What's going on everybody! Welcome again to my blog! In the previous article, I had written about Simple Linear Regression and had explained how the algorithm works. But the article was completely theoretic and had no implementations. So, this in this article, I shall show you how to actually put the algorithm to work. In case you have not referred to the previous articles, you may refer them here. In case you feel any difficulty during the implementation provided in this article, feel free to let me know through the contact form provided below the article. If you like this article, please make sure to give it some applauses and also share it over your preferred social media using the links provided. Do provide your feedback or suggestions which may help me improve the blog even better. So, cutting off the talks, let us jump straight to the implementations.
As discussed in the previous post, I will be providing the implementation of Linear Regression both, self-implemented as well as using a pre-built library. The language of usage will be Python and we will be using Scikit Learn as our library.
As we are going to implement Single variable Linear Regression, it is difficult to find a real world dataset for this type of problem as most of the prediction data generated will be using more than one features to predict the output. Thus, it becomes the problem of Multivariate Linear Regression. So, to overcome this, we will be generating our own dataset and will be feeding it to the algorithm. Do not get disappointed, we will be using a real world dataset for our experimentations when we will be implementing Multivariate Linear Regression. Moreover, in case you get access to a compatible dataset which can be fed into Simple Linear Regression algorithm, please carry on your experiments with the data and let me know of the results. First of all, let us start with the implementation from scratch.
For this implementation, we will require some helper python libraries like Numpy, Random and Matplotlib. Numpy is an opensource Python library for carrying out numberical calculations easily. In case you are not familiar with the library, you may refer to its documentations. 'Random' is a Python built-in library which we will be using to randomise our data to make it as real as possible. You may refer to the documentations of 'Random' here. So, let us walk through the implementation:
1) Installation:
Numpy library is not a built-in library and needs to be installed in the system. I recommend using and installing it in a virtual environment. You may refer to this article to install and create a Python virtual environment. If you do not want to use a virtual environment, you may carry on with the steps without setting it up. To install Numpy in the system, execute the following code in the terminal (or cmd):
~$ pip install numpy
~$ pip install scikit-learn
~$ pip install matplotlib
2) Importing the Libraries:
import random
import matplotlib.pyplot as plt     ## For data visualization
import numpy as np
3) Creating Data:
x = np.array([random.randint(1,200) for _ in range(50)])       ## Generates a numpy array of 50 random integers between the range of 1 and 200
x_test = np.array([random.randint(200, 300) for _ in range(10)])              ## Ten random numbers for evaluation of our algorithm
a0 = random.random()
a1 = random.random()                  ## Generates the relation y = ax + b but we do not know the coefficients
y = np.array(a1 * x + a0)
y_test = np.array(a0 + a1 * x_test)
max_iters = 45                     ## You may need to experiment with these values as we are using randomly generated coefficients
alpha = 10**-5
4) Visualization of Data:
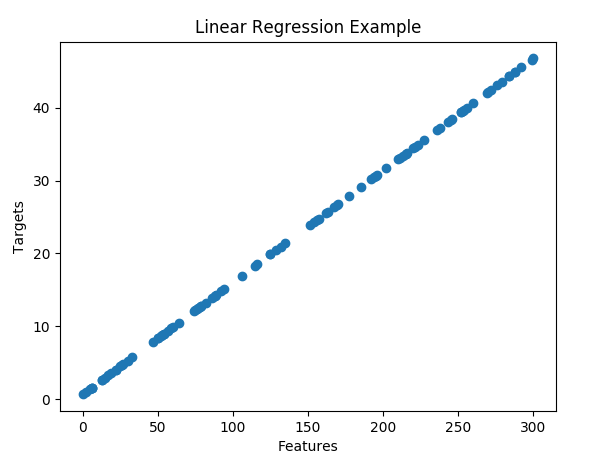
Let us plot the graph of X versus Y to view the relation between them. I am using a scatter plot to plot the data:
plt.scatter(x,y)
plt.title('Linear Regression Example')
plt.xlabel('Features')
plt.ylabel('Targets')
plt.show()
The plot should look something like this:

This is the perfect representation as we had created a linear data.
5) Implementing the Algorithm:
Let us implement the algorithm:
def cost(x, y, coeffs):                                     ## Function to compute the cost
    a0 = coeffs[0]
    a1 = coeffs[1]                                          ## Assigning values of a0 and a1
    c = np.sum(((a1*x + a0)-y)**2)/(len(x))                 ## Using the formula of the cost function (Mean squared error)
    return c
The above function computes the cost provided the X, Y and Coefficients. Here, Coefficients is a list of values [a0, a1]. The following function carries out the Gradient Descent according to the provided data, value of alpha and the value of the coefficients:
def GradientDescent(x, y, coeffs, max_iters=max_iters, alpha=alpha):
    cost_history = []                                                        ## This list will store the cost obtained per iteration. It will
                                                                             ## be used later for data visualization
    n = len(x)                                                               ## Number of training examples
    for i in range(max_iters):
        print("Running iteration number {}".format(i+1))
        cost_history.append(cost(x, y, coeffs))
        pred = coeffs[1]*x + coeffs[0]                                         ## This is the computer's prediction
        delta_a0 = (2/n)*np.sum(pred-y)                                      ## Differentiation of cost function with respect to a0
        delta_a1 = (2/n)*np.sum((pred-y)*x)                                  ## Differentiation of cost function with respect to a1
        coeffs = coeffs - alpha*np.array([delta_a0, delta_a1])                           ## Updation of the coefficients

    print("Training Completed")
    return (coeffs, cost_history)
The above function was the heart of our algorithm. In case you have not understood the applied implementation, I have discussed this in detail in my previous post. I suggest you refer to the equations derieved in the post and you will get the idea.
The following function allows us to predict the target value given feature value and the coefficients:
def predict(x, coeffs):
    return coeffs[1]*x + coeffs[0]
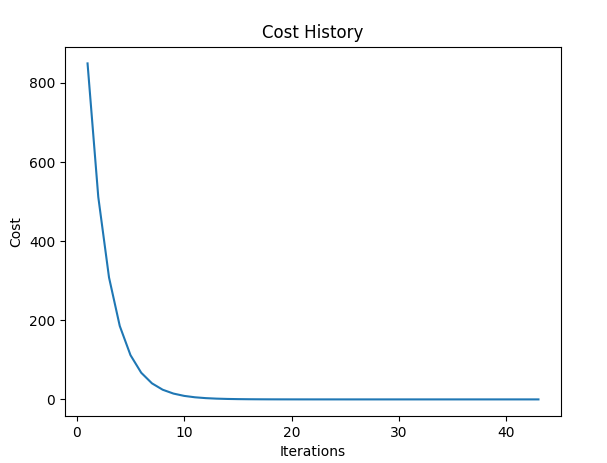
Plotting the Cost values with respect to the number of iterations, we get a graph like the following:

So, this was the implementation of Simple Linear Regression from Scratch. You can download the full, commented and stepwise code of the implementation by clicking here.
Implementing Linear Regression using Sklearn:
The Sklearn library comes prebuilt with high level implementations of various algorithms along with optimizations. Also, it is really easy to use relative to implementing the code from scratch. Implementing the above code for Linear Regression in Sklearn is as easy as writing just two lines of code! Here is the implementation (Download the full code here):
from sklearn.linear_model import LinearRegression               ## Import the module
reg = LinearRegression()               ## Create an instance of LinearRegression class
x = x.reshape(-1,1)                    ## As we have only one feature. Refer to the docs of np.reshape for more information
reg.fit(x,y)                           ## Similar to our GradientDescent function
print(reg.coef_, a[1])
print(reg.intercept_, a[0])            ## Does pretty well
Pretty cool! Isn't it? So, these were the implementations of Linear Regression in single variable both, using external library as well as from scratch. Please let me know your feedback regarding this article and if you liked the article, please share it on your preferred social media using the links provided below. Also, do suggest me about any improvements which I may implement to make the blog even better using the feedback form provided. I shall see you soon again with a new algorithm. Until then, have a great time!


Send a Feedback or Suggestion
The Email ID entered will only be used to contact you back if required. It is NOT stored by the website